
Hydroponics
Working to determine the maximum salinity level a plant can tolerate while simultaneously thriving in a nutrient film technique hydroponic system that closely resembles the San Joaquin Valley.
Important Links
-
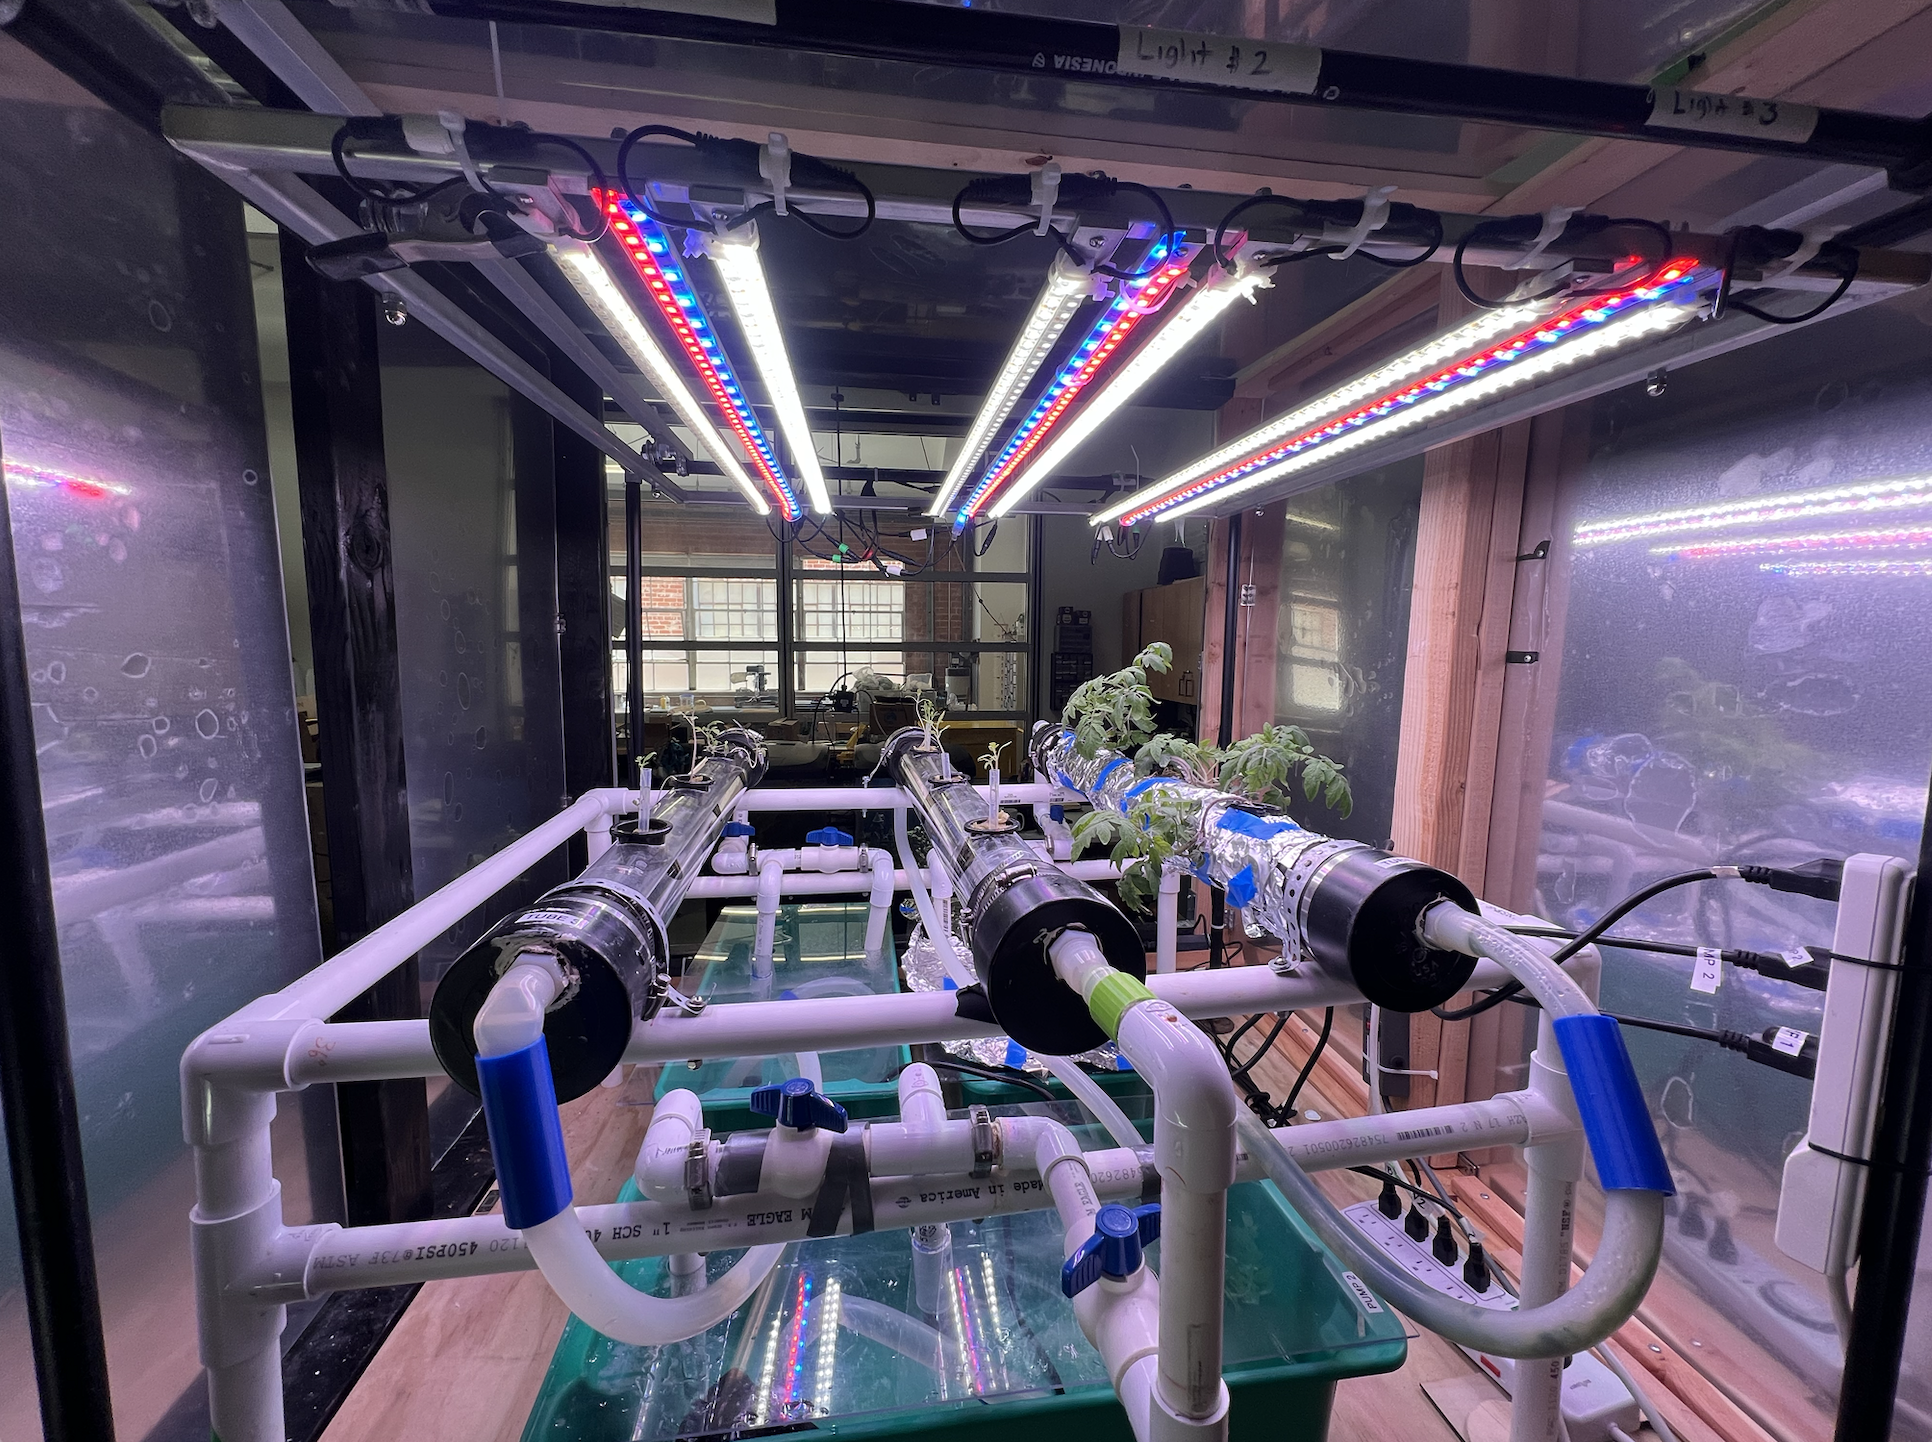
Hydroponics is a subset of hydroculture that focuses on cultivating plants in nutrient solutions with or without the use of an artificial medium such as sand or gravel but without soil. Hydroponic systems are categorized as open systems meaning the nutrient solutions delivered to the plant aren’t reused or as closed where the solution is reused. Hydroponics is groundbreaking because it can be highly productive and conserve plenty of water, land, and the overall environment. Furthermore, success in hydroponic culture only requires basic agriculture skills. Regulating the root environment is crucial to the health of the plant so hydroponic labs are set up in enclosed spaces in order to control air and root temperatures, light, water, plant nutrition, and climate (Jensen, 1997, p. 1081). There are 6 basic hydroponic systems: Wick, Water Culture, Ebb and Flow (a.k.a. Flood and Drain), Drip, Nutrient Film Technique (N.F.T.), and Aeroponic. The system used in this lab is the Nutrient Film Technique. N.F.T. systems have a constant flow of nutrient solution and a submerged pump. In these systems, the nutrient solution is pumped into a tray or tube holding the plants, flows over the roots of the plants, and then drains back into the reservoir. Typically, there are no other growing mediums other than air, making it a cost-effective system. The plants are grown in small plastic root baskets, with the roots dangling out of the bottom and into the nutrient solution. These systems are very susceptible to power outages and pump failures which interrupt the flow of nutrients and cause the roots to dry out rapidly (“Basic Hydroponic,” n.d.).
The San Joaquin Valley, located in Central California, is a densely populated agricultural region. This region is the highest producing in California, the state with the highest production of agricultural goods. The region also has the highest mean farm size and gross production per farm, while simultaneously having one of the lowest total numbers of farms in the state by region. That factor shows how the region has become industrialized and more of a model for agricultural efficiency rather than sustainability (Klonsky & Tourte, 1996). Apart from these agricultural factors, California is a rapidly expanding state. As the north and south parts of the state have started to become overpopulated, many people have decided to look to central California for a place to live, causing a population boom. The problem with this is the more people, the more clean water is needed, and without sufficient water in the region; the concentration of minerals increases (“Salinity in the Central,” n.d.).
Currently, the California Water Project uses the San Joaquin Delta as a liminal space for the water being transported to Central California, unfortunately, the delta is subject to salt contamination from the ocean which begins the salinity contamination process for the valley (California Environmental, 2006). Thousands of years ago, the San Joaquin Valley was part of the Pacific Ocean, which accounts for the naturally occurring high levels of salinity in the region (“Salinity in the Central,” n.d.). When water is transported through the region, the CWP often uses the underground passage for better irrigation and less evaporation. This water becomes contaminated with nitrate, oxidized, and dried nitrogen, which comes from improperly discarded fertilizers. Furthermore, the salt already in the water from the delta cannot be diluted into the ground due to the impermeable clay layer that covers many of the valley’s aqueducts. This water, without the proper drainage, will simply evaporate leaving behind all the salt, nitrate, and excess minerals it had picked up on its journey from the Sacramento Basin. This leaves both the surface and underground with increasingly high concentrations of salinity (California Environmental, 2006).
The rising salinity will continue to create long-term damage to the land and eventually make it completely barren. Additionally, the current effects of the salinity crisis occurring in the San Joaquin Valley could spread throughout the regions surrounding the valley if the issue is not contained and fixed. This could have devastating effects for not only California but the entire United States and could potentially even lead to a food crisis in America. Overall, the effects of the salinity crisis will only intensify as time goes on until it reaches nearly irreversible effects and environmental ruin (“Salinity in the Central,” n.d.).
-
The primary research goal for the Hydroponics Lab is to determine the maximum salinity level that a plant can tolerate while simultaneously thriving in an agricultural setting. The lab is designed to control the flow of water, the nutrient level, and the amount of salt present, all while being able to observe the plant’s reaction and growth in relation to the increasing salt levels.
Through the use of the Hydroponics Lab, the plan is to observe how changes in salinity levels will affect plant growth and health; and the possible methods plants use to combat this challenge. The salinity increases is the salinity threshold of San Joaquin’s crops. By testing multiple levels of salinity on crops grown in the valley in a hydroponic environment, quantitative data will be collected to understand how much salt a plant can withstand. A central concern of the salinity crisis is the future of agriculture both in the San Joaquin Valley and other locations with similar issues. Through the research achieved with the Hydroponics Lab, the lab will gain to understand how rising salinity levels will affect the types of plants that can survive and those able to thrive in the valley. The salt content of the soil may pose an adaptable environment for some plants and a deadly threat to others; the Hydroponics Lab is designed to find the plants, out of those currently being grown in the San Joaquin Valley, that can continue to be produced as the environment changes. As a clearer idea of how crops endure higher salt content becomes more evident, an understanding of what plants do to individually grow and survive in a saltier environment can be established. Understanding the survival methods of plants against rising salinity will help explore the possibility of acclimating plants to higher salinity environments. The question posed is whether or not a faster acclimation of a plant is possible.
Journal
-
Item description
-
Oct 3: The code has been updated! The code is adapted so that the background noise is limited. It now also works for raspberry pi so that it can be set on a timer, taking a photo and analyzing it every set period of time.
Sep 28: For software, there is now code for the raspberry pis to communicate with each other. Currently testing software for analyzing plant health. You can find the code here: https://github.com/LAdelsbach/WISRD/tree/main/PlantCV
Sep 27: The Hydroponics Handbook is finished! This will be a working document that will constantly be evolving, but this is a good foundation. As new updates occur in the lab, the hope is that this document will be updated accordingly.
Sep 21: Added NaCl over the course of three days so as not to shock the plants. This will require the adding of 27.649g NaCl each day to Tube 2 and 55.305g Nacl each day to Tube 3. Added the first installment of each and will observe how best to disperse it.
Sep 19: Calculated the NaCl amounts required to attain a concentration of 75 mmol/L and 150 mmol/L and found that 82.957g NaCl and 165.915g NaCl were required respectively.
Sep 12: The saplings seem to be doing well in the biochamber, and Megan spotted a small leak which was fixed by caulking it.
Sep 11: All three tanks were filled, as we opted to add salinity later to better represent the climate of the San Joaquin Valley. All three motors were tested and then all tubes were filled to a suitable water level while making sure the water flow would keep the levels consistent. All nine saplings were added into the biochamber tubes, ensuring that the roots were able to access the water.
Sep 5: The saplings have all shown signs of growth, ranging from 0.2cm to 1cm stem growth. The water pumps have been cleaned, and we will start the calculations to ensure that proper NaCl levels are reached. Sapling growth will be monitored, and it is expected that another 4-9 days of growth are needed.
Aug 30: We have returned to the school year and are excitedly jumping back into Hydroponics work. We have gained a new member named Alessandra, and are currently training her and acclimating her to the processes of the lab. We are finishing the Hydroponics Handbook and are nearing a place where it is a full comprehensive record of our work. We are cleaning out the lab and preparing to start a new trial shortly. We hope that during this year we will finally achieve conclusive results on the salinity threshold that Paul Robeson Tomatoes can survive in. Twelve saplings have been planted in the grow bin and will be illuminated directly for 24 hours a day.
-
Oct 20: The surrounding case is nearly completed and painted. We deconstructed the hydroponics setup for cleaning and are going to reconstruct it within the next few days. We hope to have water running through the lab by Dark Matter Day on the 26th.
Sept 19: We are building a surrounding case for the Hydroponics Lab. Ridley is headlining this process and has been hard at work woodworking. We have a new member: Ivy. Ivy is building a miniature version of the hydroponics tank in order to help her get acclimated to the lab process. Kezie is continuing to develop PlantCV. She will be our main measurement person for this year. She is going to try out PlantCV in Ivy’s mini-lab. Once the surrounding case is finished we will resume experimenting on the main lab.
-
May 10: We have placed the new plants into the lab, which only consists of our two variable tubes of water. Our control lab will be filled with water within the week. We added aluminum foil to prevent the spread of algae.
Apr 13: We have begun to plant new plants, as the two-week break from school would have brought many inconsistencies with our results with the lack of results for a long period of time. We also plan to use larger increments of salt, as the increments we used did not faze the plants in a noticeable way.
Apr 12: We have run into troubles with the camera and its use outside of school. We have been working to find the issue that prevents it from working. We have filled gallons of water that we may need for use in the future.
Mar 13: We have started a discord with a bot that will alert us in the situation the lab overflows. It also is being used as a means to communicate about the project outside of school.
Feb 25: We have placed aluminum onto the tubes, as the aluminum will reflect light, which will lower the possibility of algae growth.
Feb 24: We have placed all of the plants into their respective tubes. They are going to be monitored based on the salinity level of the water
Feb 16: We tested the salinity of the different waters. We are also continuing to work on the salinity sensor.
Feb 10: We have wrapped aluminum on the three tubes used in the lab to prevent algae growth for when we start planting. We added salt to our two variables in the experiment, one having 66.418 grams of salt and the other having 132.836 grams.
Feb 3: We have planted and watered the plants that we will ideally use for the lab. We have plans to put water in the lab on Monday, which will be the day of setting things up.
Feb 1: We have taken out the tubes to clean in preparation for the actual plants we will use for the lab. We have taken out the plants from our previous trial to record and observe.
Jan 26: We are planting seeds with the intent to place them in the lab on Monday. We also have found a program that will alert us in the case of an overflow, giving up us a chance to stop before further damage occurs.
Jan 25: The aluminum foil test has been successful. It appears that the water in the tubes covered in foil has no shown algae growth. Our plan is by the end of the week, we will empty all of the tubes and prepare for putting in new plants. We also plan that next week, we should have salinity sensors in the lab
Jan 14: We took our research and Bob’s suggestion to put aluminum foil onto the water tubes in the lab. This is supposed to discourage algae growth, as there will be very limited sunlight for the algae to get access to.
Jan 13: We have distilled water as a reservoir in case we need more. We found the standard deviation of the water sensor results, which lets us know that the sensors are useable and consistent.
Jan 12: We have uncovered a leak. We have also found that we have algae, but there isn’t too much we can do about it. Our lab consists of water, nutrients, and light, which are all striving factors that promote algae growth. A plan we have decided on is using a brush to rid of the algae. We have obtained more water sensors, which let us be able to record data on the other two rows of plants. We have again added nutrients to all the plants, which consist of 10 mL of Bud A and B, given to each
Jan 11: The water sensor we have been using is corroded. We have ordered a new water sensor, which will be a different brand than the previous one. We have implemented stilts for our growing plants to ensure positive growth. We have planted a new row of plants. We are going to practice our new measurement strategy with this new row of plants. We have also added nutrients, which consist of 10 mL of Bud A and B, given to each plant.
Jan 5: After returning from winter break, we realized that Algae is growing within the lab. We plan to eventually clean and restore the lab. We have been preparing to make an incision for the water sensor. We have posted a tweet on the WISRD account, which documents the growth and progress of the lab, which can be seen here.
Dec 17: We have spoken with tech to get the camera back online, as there were issues with the port we were using for the Raspberry Pi. We also have completed one of the sensors, which is consistently working to complete our objective. We are also planning to make an opening in the lab to place the water sensor.
Dec 9: We have successfully planted three plants in the lab. We also are building other water sensors, to improve the quality of the lab.
Nov 19: We have all the water we need to start the lab. We are now awaiting results regarding the PlantCv and information about Butterhead Lettuce.
Nov 17: We have cut the old sprouts and have replanted them. Our plan is to clean the tubes once again, so by the time the place has sprouted, we will be ready.
Nov 8: We have completed the poster, and we will present them tonight. We have practiced our assigned parts, to ensure the quality of the presentation. The ramp we have been working on is also completed.
Nov 3: We have been preparing the poster for our presentation. We also have been working on a ramp, to ease the process of emptying the distilled water. We took suggestions from J.A Wise, which helped the overall quality of the lab
Oct 27: We have finished the Arduino that would allow notify us if the lab overflows, giving us the opportunity to close the lab. We have begun working on a sensor that would allow us to see the salinity of the water remotely.
Oct 21: We are overcoming the problems with the camera, as it is properly working now. We have begun setting up the Arduino, which its goal is to inform us if the lab overflows. If that were to happen, it would send us a text so that we could turn off the experiment from anywhere. We have put the conductivity results into a document for accessibility.
Oct 20: We have run into a problem with the camera, as it no longer appears when you visit the website. We also have broken the dolly, which has since then been repaired. We have finally finished the conductivity results of running the water through the distiller.
Oct 14: The plants have grown faster than the pace of the project. The conductivity results are invalid, due to the inconsistencies of our data. We are beginning to restart recording data to see what is the lowest possible conductivity we can find. Also, the dolly is fully constructed
Oct 5: The conductivity of the distilled and tap water has been completed. It was recorded using a conductivity sensor using the PASCO software. The results were recorded in ten-second intervals ten times. The water distiller is now being used, as we have distilled the water in the distiller once. We are also constructing a dolly for the distiller to further better use
Sept 28: The webcam is now completed. The live stream can be seen while using the WISRD wifi at Wildwood. We are understanding the uses of the water distiller for the use of the lab.
Sept 24: We have been observing the plants’ growth and have added a support beam for one of the plants. We have also worked on a live stream webcam, which would allow us to monitor the lab without physically being there.
Sept 22: We have now planted 8 pots with 4 seeds in each pot. We have utilized a new space specifically for the plants and lighting.
Sept 21: We have cleaned all of the parts of the lab that involve the water. We are preparing to plant the butterhead lettuce. We have planted 5 containers with the soil-like substance. We also have fixed the lights, which will be used as the source of light for the plants.
Sept 15: We have continued to filter the water throughout the lab and are continuing to make observations on what we have seen
Sept 14: We have gained a new member, Lukas. Last week, we established a “Master Doc” that we will use to store important documents and assign tasks for each member. Today, we have relabeled the essential parts of the prebuilt rig. Began to filter the water. We also have put on the 3d model on the tubes, to improve circulation.